A brief Intro to A/B Testing
Introduction
A/B testing is a type of hypothesis testing commonly used in business. It is mainly useful on for products that are mature and is suitable for fast iterative product development. The main idea is to assume a new modification is useful and take trials/experiments upon the modified product. Next, using the old version as a reference, see how significant is the improvement brought by the new modification.
Note: When we say new modification, it must be warned that the change should contain only one factor, otherwise the influence can be compounded.
11 Steps in A/B Testing
- First time trying something new: run an A/A testing simultaneously to check for
systematic biases
Systematic Bias: is sampling error that stems from the way in which the research is conducted. There are three types:
a. Selection bias: Biased way to select the factors/samples.
b. Non-response bias: the participants/customers involved in your tests are different in their behavioral patterns from the people that are not involved in your study (other general public)
c. Response bias: The result/inference that are given does not follow the truth/real observations.
- Define the goal and form hypothesis
Null hypothesis: a general statement or default position that there is no relationship between two measured phenomena. Often claimed to be the case when there is no association between the performance of product and the a feature change of the product. If we believe otherwise, then we are arguing for a Alternative hypothesis.
- Identify control and treatment groups
- Determine factor to change (make sure no confounding factors are included)
- Determine sample size: general rule is
where is the sample standard deviation and is the difference between the control and treatment. - Determine duration: usually about 1-2 weeks, but highly dependent on budget and nature of the business
- Identify KPI/metrics to measure
- e.g: click through rate, conversion rate, renewal rate, bounce rate, average retention, etc…
- Identify what data needs to be collected
Sometime people use the Customer Funnel analysis:
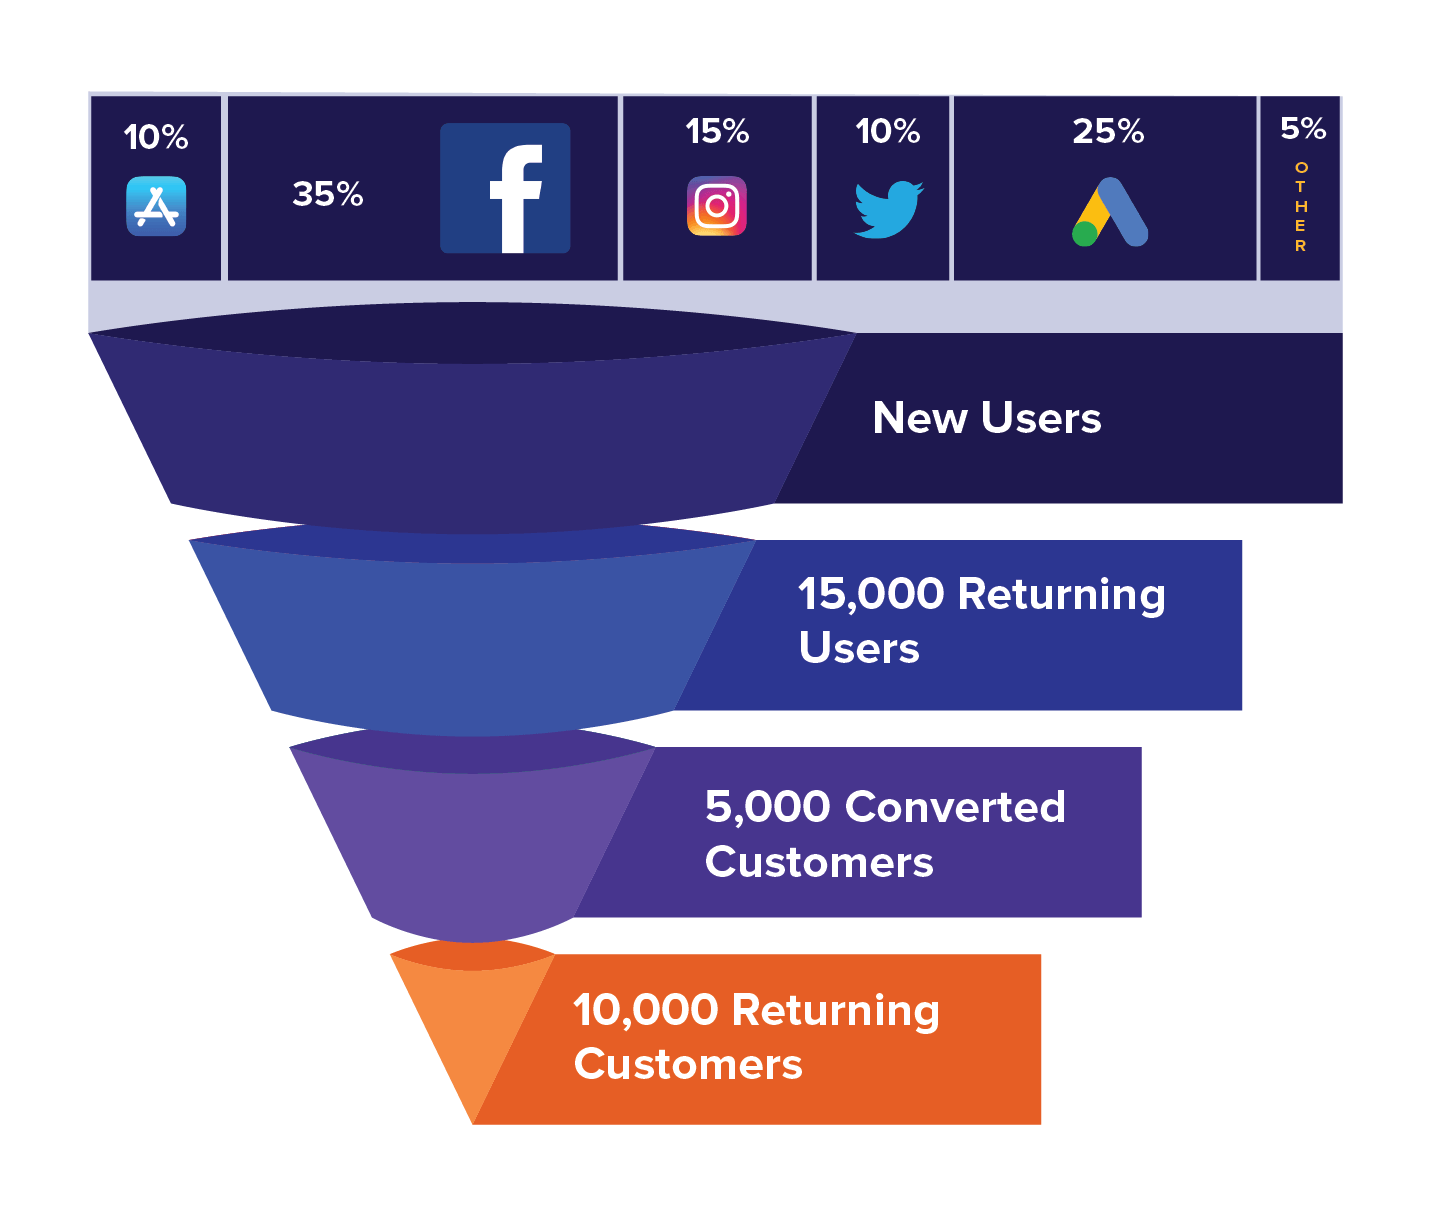
credit: https://clevertap.com/blog/funnel-analysis. Example: [Netflix - Funnel Description] Customer will enter the home page, which invites customer to further enter via the button
free trial for one month, then customer will try and then register and payExample: [Netflix - Funnel Analysis]Funnel analysis: here the funnel will be how the product will affect each steps like
improving converted customer sizeorimproving returning customer size, during the procedure to reach click through/subscription, what side-effects/main effects are triggered
- Make sure that appropriate logging is in place to collect all necessary data
- Determine how small of a difference can be (define significance level and thus power of the experiment)
Significance Level: the decision threshold and basically the probability that we reject the null hypothesis while it is true (type I error). A lower significance level indicates an underlying difference between the baseline and the control. In the majority of cases, the thresholdvalue is about 0.05. P-Value: the probability that the difference between two values is related to random chance. The lower the p-value, the more likely H0 is to be discarded. As a result, what you saw did not happen randomly.Power: is the probability of rejecting the null hypothesis while it is false (type II error).Example:
+ p-value is less than -> reject and Conclude .
- Determine what fraction of visitors should be in the treatment group (control/treatment split ratio)
- Run a power analysis to decie how much data is needed to collet and how long to run the test
- compute running time given customer flow
- Run the test for AT LEAST this running time long
- (*) For comparing ML algorithms, consider McNamer’s Test or 5x2 CV or Nonparametric Paired Test. You can find the details in this post
- Sanity Checks and post-experiment validation: Ensure to take a review of all the executions, subjects and objectives are as expected.
Before you run A/B testing…
1. Why should you run a A/B test?
- A/B testing is the key to understand what drives your business and make data-informed business decisions
- To understand the causal relationship and not simply the correlations
2. When to run experiments
- Deciding whether or not to launch a new product or feature
- To quantify the impact of a feature or product
- Compare data with intuition (Understand how users respond to certain parts of a product)
3. When not to run experiments
- No clear comparison between the control and experimental group
- Emotional changes need time: Logo/Brand name
- Response data hard to obtain
- Too time consuming/costly
A closer look at Type I and Type II errors
1. Terminology
significance level: The significance level for a given hypothesis test is a value for which a p-value less than or equal to is considered statistically significant. Often denoted by αregion of acceptance: The range of values that leads the researcher to accept the null hypothesis. [significance level↓region of acceptance↑ : harsher condition to produce a winner]effective size: The difference between the true value and the value specified in the null hypothesis. [Effect size = True value - Hypothesized value]
2. Type 1 Error
- When the
Null Hypothesisis true but rejected - 'false positive' - happen when the tester validates a statistically significant difference even though there isn’t one (no winner situation).
positivehere means a valid winner concluded - Type 1 errors have a probability of "α" correlated to the level of confidence that you set. A test with a 95% confidence level (α = 0.05) means that there is a 5% chance of getting a type 1 error.
- [In business sense] This means that you will wrongfully assume that your hypothesis testing has worked even though it hasn’t.
- [The business consequence] Potential loss of money after adjustment is made, because your variation didn’t actually beat your control version in the long run.
3. Type 2 Error
- When the
Null Hypothesisis false but accepted - 'false negative' - Happens when you inaccurately assume that no winner has been declared between a control version and a variation although there actually is a winner (can be either)
- The probability of a type 2 error is "β". β depends on the power of the test (i.e the probability of not committing a type 2 error, which is equal to 1-β).
- There are 3 parameters that can affect the power of a test:
Sample size (n): Other things being equal, the greater the sample size, the greater the power of the test (but also the more expensive of the test).Significance level of test (α): The lower thesignificance level, the lower the power of the test.- If you reduce the
significance level(e.g., from 0.05 to 0.01), theregion of acceptancegets bigger. As a result, you are less likely to reject the null hypothesis. This means you are less likely to reject the null hypothesis when it is false, so you are more likely to make a Type II error. In short, the power of the test is reduced when you reduce the significance level; and vice versa.
- If you reduce the
- The "true" value of your tested parameter or
effective size: The greater the difference between the "true" value of a parameter and the value specified in the null hypothesis, the greater the power of the test.
- [The business consequence] Potential loss of money after adjustment is made, because your variation didn't actually beat your control version in the long run
Toolkits
- Usually the test plan/create variation step can be executed with company's own techpack, or using some popular tools
- Google optimize
- optimizely
- For hypo testing and result analysis: online resources of excel's A/B testing macro are widely available
A brief Intro to A/B Testing